
Selecting a thermistor (& series resistor) value
Most of the material you find on thermistors makes the assumption that you are trying to maximize sensitivity and interchangeability. But oversampling gives you access to enough resolution that sensitivity is less critical, and interchangeability only makes sense if you are putting them in a product with good voltage regulation. In that case, precision thermistors like the ones from US sensor are a good option, but according to Campbell Scientific, that choice has other knock-on implications:
“The resistors must be either bought or selected to 0.02% tolerance and must also have a low temperature coefficient, i.e. 10 ppm or preferably 5 ppm/°C.”
Like many better quality components, these resistors are often only available in SMD format, with minimum order quantities in the thousands. If you use a typical 1% resistor with a T.C. of 50 ppm or more, you could introduce errors of ±0.1°C over a 50°C range, which defeats the point of buying good thermistors in the first place.
Still, if I was only building a few sensors, I’d spring for the good ones. But now that I have oversampling working on the Arduino, I’d like to add a thermistor to every logger in the field, and the mix of different boards already in service means I’ll have to calibrate each sensor/board combination. That time investment is the same whether I choose a 10¢ thermistor or $10 one.
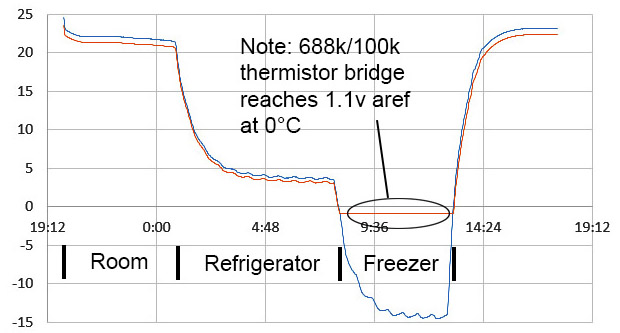
Power consumption is also important, making 100kΩ sensors attractive although I couldn’t even find a vendor selling interchangeable thermistors above 50k. A low temperature limit of 0°C (the units are underwater…) and putting 1.1v on aref to boost sensitivity, requires a 688k series resistor, which is far from the 1-3x nominal usually recommended:

Here I’ve overlaid an image from Jason Sachs excellent thermistor article at Embedded Related, which shows I will only see about ⅓ of the sensitivity I would get if I was using a 100k series resistor. I highly recommend reading Jason’s post, despite the fact that I’m ignoring almost all of his good advice here… 🙂
Using the internal band-gap voltage as aref improves the ADC’s hardware resolution from 3.22mV/bit to 1.07mV/bit. This trick gives you a extra bit of precision when you use it at the default 10bit resolution, and I figured I could do it again to compensate for the lost sensitivity due to that big series resistor.
In return, I get a combined resistance of at least 700k, which pulls only 4.7μA on a 3.3v system. Such low current means I could ignore voltage drops inside the processor and power the divider with one of Arduino’s digital pins. In practical terms, burning less than a milliamp-second per day means adding a thermistor won’t hurt the power budget if I leave it connected to the rails all the time; which you can only do when self-heating isn’t a factor. This is quite handy for the bunch of old loggers already in service out there, that I want to retrofit with decent temperature sensors.
Even 100 ohms of internal chip resistance would produce only 0.5mV drop, so depending on your accuracy spec, you could use 16-channel muxes to read up to 48 thermistors without worrying about cable length. There aren’t many of us trying to connect that many temperature sensors to one Arduino, but using a 100k thermistor also makes me wonder if you could mux a bank of different series resistor values, pegging the divider output at it’s maximum sensitivity over a very large temperature range.
What is a reasonable accuracy target?
Combining 5¢ thermistors & 1¢ metfilms, means my pre-calibration accuracy will be worse than ±1°C. Cheap thermistor vendors only provide nominal & βeta numbers, instead of resistance tables, or a proper set of Steinhart-Hart coefficients. So I might be limited to ±0.4°C based on that factor alone. And it took me a while to discover this, but βeta values are only valid for a specific temperature range, which most vendors don’t bother to provide either. Even with quality thermistors, testing over a different temperature range would give you different βeta values.
In that context, I’d be happy to approach ±0.1°C without using an expensive reference thermometer. Unfortunately, temperature sensors in the hobby market rarely make it to ±0.25°C. One notable exception is the Silicon Labs Si7051, which delivers 14-bit resolution of 0.01°C at ±0.1°C. So I bought five, put them through a series of tests, and was pleasantly surprised to see the group hold within ±0.05°C of each other:

Temps in °C. Compared to what I usually see when I batch test temperature sensors, this is pretty impressive for an I2C chip that only cost $9 on Tindie.
Ideally you want your reference to be an order of magnitude better than your calibration target, but given the other issues baked into my parts, that’d be bringing a gun to a knife-fight.
So my calculations, with oversampling, and the internal 1.1v as aref become:
1) MaxADCReading (w scaling factor to compensate for the two voltages)
= ( [2^(OverSampledADCbitDepth)] * (rail voltage/internal aref) ) -1
2) Thermistor Resistance (w series resistor on high side & thermistor to GND)
= Series Resistor Value / [(MaxADCReading / OverSampledADCreading)-1]
3) Temp(°C) (ie: the βeta equation laid out in Excel)
=1/([ln(ThermResistance/Tnominal R)/βeta]+ [1.0 / (NomTemp + 273.15)]) -273.15
Seeing the error in my ways
I knew that the dithering noise would have some effect on the readings, and all the other source ADC of error still apply. Switching to 1.1v reduces the absolute size of most ADC errors, since they are proportional to the full scale voltage. But the internal reference is spec’d at ±0.1v; changing the initial (rail voltage/aref voltage) scale factor by almost 10%. Since all I needed was the ratio, rather than the actual voltages, I thought I could address this chip-to-chip variability with the code from Retrolefty & Coding Badly at the Arduino.cc forum. This lets Arduinos read the internal reference voltage using the rail voltage as aref.
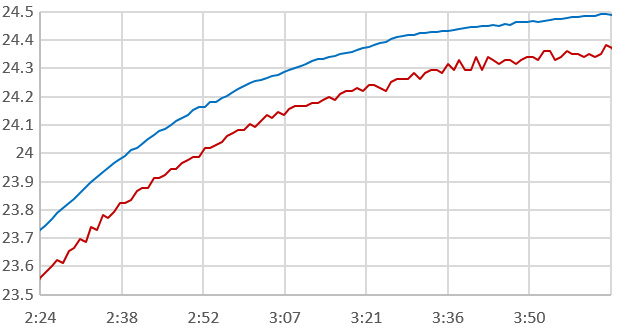
I started testing units in the refrigerator to provide a decent range for the calibration:
Si7051 in blue vs 100K thermistor in red. The sensors were held in physical contact. ADC was read with 1024 oversamples providing approximately 15bit resolution. Temps in °C.
and strange artifacts started appearing in the log. The voltage readings from both the main battery and the RTC backup battery were rising when the units went into the refrigerator, and this didn’t seem to make sense given the effect of temperature on battery chemistry:

Si7051 temp. in °C on the left, with the RTC backup battery (V) in green on the right axis. The CR2023 is monitored through a 2x10MΩ divider, using the 3.3v rail as aref. The large number of ADC readings needed for oversampling has the side benefit that it lets you read very high impedance dividers, but by the time you reach 10Meg ohms, you pick up 5-10 points of noise in the readings. Which is why that coincell voltage line is so thick.
I think what was actually happening was that the output from the regulator on the main board, which provided the ADC’s reference voltage for the battery readings, was falling with the temperature.
When I dug into what caused that problem, I discovered that temperature affects bandgap voltages in the opposite direction by as much as 2 mV/°C. So heating from 0°C to 40°C (and some loggers will see more than that…) reduces the 328P’s internal reference voltage by as much as a tenth of a volt. In fact, bandgap changes like this can be used to measure temperature without other hardware. This leaves me with a problem so fundamental that even if I calculate S&H constants from a properly constructed resistance table, I’d still be left with substantial accuracy errors over my expected range. Argh!
Becoming Well Adjusted: (Beta ain’t better…)
These wandering voltages meant I was going to have to use the internal voltmeter trick every time I wanted to read the thermistor. It was mildly annoying to think about the extra power that would burn, and majorly annoying to realize that I’d be putting ugly 10bit stair-steps all over my nice smooth 15bit data. This made me look at that final temperature calculation again:
Temp(°C) =
1/([ln(ThermResistance/Tnominal R)/βeta]+ [1.0 / (NomTemp + 273.15)]) -273.15
which I interpret as:
=fixed math( [(ADC outputs / Therm. nominialR ) / Therm. βeta] + (a #) ) – (a #)
Perhaps tweaking the thermistor’s nominal value (which I only know to ±5% anyway) and changing the (fictional) βeta values would compensate for a multitude of sins; including those voltage reference errors? Then I could just pretend that (rail/aref) scaling factor had a fixed value, and be done with it: (click image to expand)
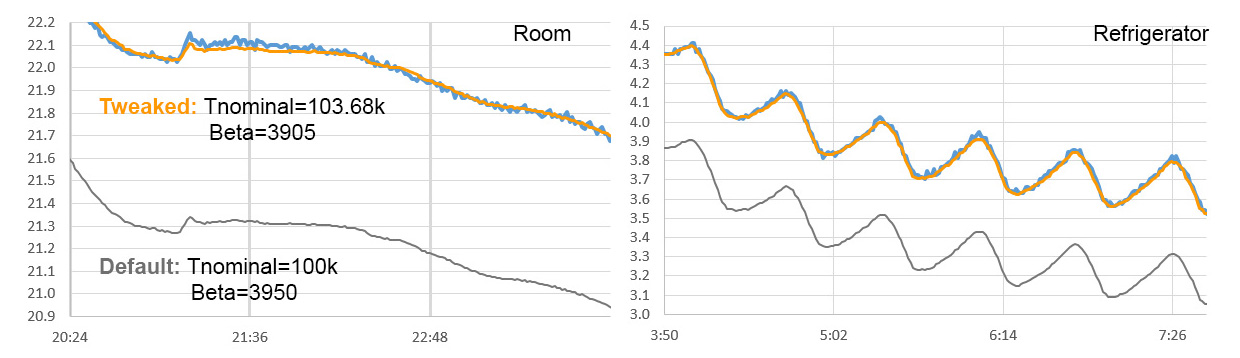
So in my early tests, all I had to do was adjust those two constants until the thermistor readings fell right on top of the reference line. Easy-peasy!
Well …almost. Repeat runs at 15bit (1024 samples) and 14bit (256 samples) didn’t quite yield the same numbers. Applying the best fit Nominal and βeta values obtained from a 15bit run to 14bit data moved the thermistor line down by 0.05°C across the entire range (and vice versa). So the pin toggling method I used to generate the dither noise introduces a consistent offset in the raw ADC readings. While that doesn’t completely knock me out of my target accuracy, I should generate new calibration for each oversampled bit depth I intend to use. It’s still good to know that the dithering offset error is consistent.
Throwing a Big Hairy Fit
I was pleased with myself for the simplicity of the Nominal/βeta approach for about two days; then I pushed the calibration range over 40° with a hot water bath:

Blue=Si7051 , Orange = 100k NTC thermistor. 1024 oversamples = ~15bit. Temps in °C.
This gave me targets at around 40, 20 and 5°C. But no combination of Nominal & βeta would bring all three into my accuracy range at the same time. Fitting to the 20 & 40 degree data pushed the error at 5°C beyond 0.2° : (click image to enlarge)
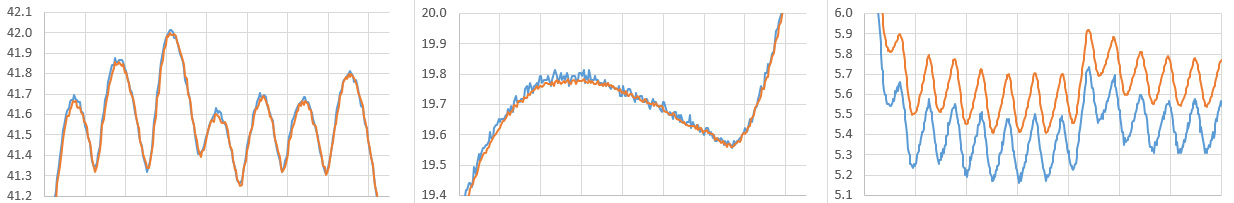
…and fitting to 20 & 5, pushed the 40C readings out of whack. After more tests I concluded that tweaking βeta equation factors won’t get you much more than 20° of tightly calibrated range.
My beautiful plan was going pear-shaped, and as I started grasping for straws I remembered a comment at the end of that Embedded Related article:
“… in most cases the relationship between voltage divider ratio and temperature is not that nonlinear. Depending on the temperature range you care about, you may be able to get away with a 3rd-order polynomial or even a quadratic..”
Perhaps it was time to throw βeta under the bus, and just black-box the whole system?
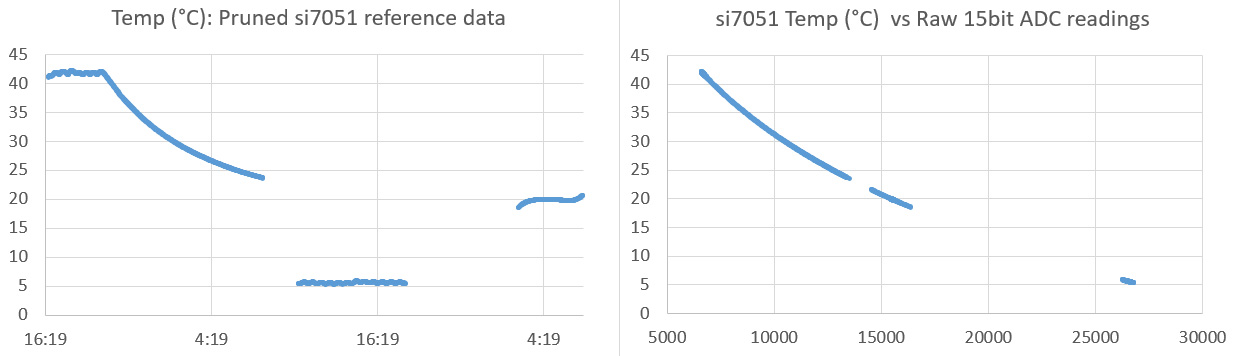
To find out, I needed to prune away the negative temperature regions where the voltage divider had flat-lined, and remove the rapid transitions since the thermistor responds to changes more quickly than the si7051: (click image to inflate)
Then it was time for the dreaded Excel trend line:

Ok, ok. I can hear people inhaling through their teeth from here. But with 15 sigfigs, Excel seems like the height of luxury compared to the constraints in μC land. I wonder what an advanced modeler like Eureqa would have produced with that dataset?
The trick for getting workable constants is to right-click the default equation that Excel gives you, re-format it to display scientific notation, and then increase the number of displayed digits to at least six.
Some people use the LINEST function to derive these polynomial constants but I’d advise against it because seeing the raw plot gives you a chance to spot problems before you fit the curve. When I generated the first Temp vs ADC graph, the horizontal spread of the data points showed me where the thermistor and the reference thermometer were out of sync, so I removed that data. If I had generated the constants with =LINEST(Known Y values, X values^{1,2,3,4}) I could have missed that important step.
For the following graphs, I adjusted the trend line to display to nine insignificant digits:

Blue =Si7051 reference, Orange is that 20&40 best fit from tweaking Nominal & Beta values, and the yellow line is the 4th order polynomial from Excel. Temps in °C. (Click to embiggen)
It took a 4th order polynomial to bring the whole set within ±0.1° of the reference line and 5th order did not improve that by much. Now I really have no idea where the bodies are buried! And unlike the βeta equation, which just squeaks in under the calculation limits of an Arduino, it’s beyond my programming ability to implement these poly calcs on a 328 with high bit depth numbers. I certainly won’t be writing those lunkers on the bottom of each logger with a sharpie, like I could with a pair of nominal/βeta constants.
This empirical fit approach would to work for any type of sensor I read with ADC oversampling, and it’s so easy to do that I’ll use it as a fall back method whenever I’m calibrating new prototypes. In this case though, a little voice in my head keeps warning me that wrapping polynomial duct tape around my problems, instead of simply using the rail voltage for both aref & the divider, crosses some kind of line in the sand. Tipping points can only be predicted when your math is based on fundamental principles, and black-boxes like this tend to fail dramatically when they hit one. But darn it, I wanted those extra 1.1v aref bits! Perhaps for something as simple as a thermistor, I’ll be able to convince the scientist in the family to look the other way.
Making the Steinheart-Heart equation work
Seeing that trend-line produce such a good fit to the temperature data, made me think some more about how I was trying to stuff those system-side errors into the βeta equation, which doesn’t have enough terms to cope. By comparison, the Steinheart-Heart equation is a polonomial already, so perhaps if I could derive some synthetic S&H constants (since my cheap thermistors didn’t come with any…), it would peg that ADC output to the reference line just as well as Excel did?
I rolled the voltage offsets into the thermistor resistance calculation by setting the (rail voltage/internal aref) scale factor to a fixed value of 3, when in reality it varies from slightly below to slightly above that depending on the board I’m using:
1) MaxADCReading (w scaling factor to compensate for the two voltages)
=(2^(OverSampledADCbitDepth) * (3)) –1
2) Thermistor Resistance (w series resistor on high side & thermistor to GND)
= Series Resistor Value / ((MaxADCReading / OverSampledADCreading)-1)
and I went back to that trimmed 40-20-5 calibration data to re-calculate the resistance values. Then to derive the constants, I put three Si7051 temp. & thermistor resistance pairs into the online calculator at SRS:

Note: There are premade spreadsheets that you can download which will generate S&H constants, or you can build your own in Excel [see pg6 of this whitepaper] There’s also coefficient calculators out there in C, Java, etc. if that’s your thing.
With those Steinhart-Hart model coefficients in hand, the final calculation becomes:
3) Temp °C =1/( A + (B * LN(ThermR)) + (C * (LN(ThermR))^3)) – 273.15
and when I graphed the S&H (in purple) output against the si7051 (blue) and the 4th order poly (yellow), I was looking at these beauties:


and that fits better than the generic poly; nearly falling within the noise on those reference readings. With the constants being created from so little data, it’s worth trying a few temp/resistance combinations for the best fit. And this calibration is only valid for that one specific board/sensor/oversampling combination; but since I’ll be soldering the thermistors permanently into place, that’s ok. I’m sure if I hunt around, I’ll find a code example that manages to do the S&H calculations safely with long integers on the Arduino.
So even with cheap parts, oversampling offsets & bandgap reference silliness, I still made it below ±0.2°C over the anticipated temperature range. Now, where did I put that marker…
Addendum 2017-04-27
Just a quick note to mention that you need to tape the thermistor to the si7051 sensor so they are held in physical contact with one another. The thermistors are tiny & react to temperature changes much faster than the si7051’s which have a much larger thermal mass because of the breakout board they are mounted on. So the temp/resistance pairs don’t match up as well as they could if the sensors are in physical contact with one another.
Addendum 2017-06-05
With 1.1v aref in the mix, my 15bit oversampled resolution on those 100k thermistors varies between 0.002 and 0.004° from 20-40°C. But I was throwing the bandgap aref in just to see if I could still make it work. From a calibration point of view, it’s better to better to use the rail voltage on aref, and remove that 3x ratio from the MaxADCReading calculation. This will lower the resolution to somewhere between 0.006 to 0.012C with a 688k series resistor unless you bump up the oversampling to compensate. In addition to tripling my noise/toggle-pin current, how much extra power do I have to pay to get that resolution back if I’m using the 3.3v rail as aref?
In my oversampling experiments, I found that the Arduino ADC works well at 250 kHz, delivering just under 19230 ADC readings /second. For the purpose of estimation, assume the Pro-mini style boards I’m using draw about 5mA during the sampling time, and I take a reading every 15 minutes (= 96 readings per day) :
15bit= 1024 reads/19230 r/sec =0.053s*5mA =0.26 mAs*96/day=~ 25 mAs/day
16bit= 4096 reads/19230 r/sec = 0.213s*5mA =1.00 mAs*96/day= ~102 mAs/day
17bit= 16384 reads/19230 r/sec = 0.852s*5mA =4.26 mAs*96/day= ~408 mAs/day
so it would cost me another 385 mAs/day to reach a resolution slightly better than I was achieving with the 1.1v bandgap on aref. Given that a typical AA battery runs about 2000 mAh = 2000 mAh*3600 sec/hour =~7,000,000 mAs, it would be quite a while before that breaks the power budget. Removing the ratio dependency also means that your S&H constants are for the resistor/thermistor pair only, making that calibration independent of what system you connect them to.
Using an Rnominial=100k series resistor would give about the same effective resolution boost as going to 17 bit, but that option costs you more power if you are leaving the thermistor powered all the time:
3.3v / 780k combined resistance = 4.23μA x 86400 sec/day = 366 mAs/day
3.3v / 200k combined resistance = 16.5μA x 86400 sec/day = 1425 mAs/day
You can power the thermistor from a digital pin, but since I’m already using digital-pin toggling to generate noise for the oversampling, I still need to test if I can combine pin power for the sensor with my oversampling technique. It’s possible that the thermistor bridge needs to be powered by the more stable rails, while I’m shaking aref inside the processor, because if the voltage on the divider started moving in sync with the ADC noise, the dithering noise will effectively disappear, and my oversampling would stop working.
Even before doing this test, I have a sneaking suspicion that 100k series vs. oversampling vs. other techniques will end up converging on the same effective resolution in the end. And I’ll even hazard a guess that the point of diminishing returns is somewhere around 0.001°C, since that’s what you see offered by quite a few high-end temperature loggers.
Addendum 2017-09-24
Just posting an update about pin-powering the thermsitor dividers while using the 3.3v rail as aref: everything works, but as I suspected you need to stabilize the thermistor with a small 0.1uF capacitor or the dither noise vanishes. This also requires you to take the RC time constant into account, waiting at least 5x T for that parallel cap to charge before you start reading the divider. You can sleep the processor during this time, since I/O pin states are preserved.
Degree Celsius vs. Time with lines offset for easier visual comparison: The blue line is over-sampled output from a pro-mini clone reading a 100k Thermistor /100k series voltage divider. Aref was set to the 3.3v rail, with a 100nF capacitor in parallel with the thermistor on the low side. This RC combination has a time constant of ~10 milliseconds. A 0.12 mA pin-current provided sufficient noise for dithering 1024 readings: to deliver an effective resolution of ~0.0028° at 24°C. For comparison, the red line is the output from an I2C si7051 sensor on the same logger, with a resolution of 0.01°C.
So using a 100k series resistor with 3.3v aref really does deliver the same effective resolution as the 680k series/1.1v aref combination, and it does not suffer the problem of bumping into the aref voltage at a certain temp. I’m using 100k termistors so the pin resistance (~40 ohms) will introduce less than 0.05% error over the range; though this pin-drop error would be higher for therms with lower Rnominal values.
Since I’m using cheap eBay 100k’s and a host of other no-name components, I have to calibrate each logger/thermistor/O.S. bit-depth combination. This isn’t much of a burden for the overall workflow, since I always give new loggers a shake-down run, in fact, I usually do a fast sampling burn for at least a week before considering a unit ready for deployment:

That Degree vs Time image above was an excerpt from a calibration run like this. I’ve found that Freezer (morning)->Fridge (afternoon)->Room (overnight) is easier to manage than the reverse order, and gives enough time at each temperature to deal with thermal lag differences between the thermistors and the reference sensors.
As before, when I do the thermistor resistance calculation I make the assumption that everything in the system is behaving perfectly (which is obviously not true). So errors from things like pin drops, temp. coefficients, ADC gain, etc., are getting rolled into the S&H constants. Essentially, I’m eliminating a host of different corrections in exchange for the interchangeability between sensors that I might have if I took all those factors into account individually. This makes it easier to standardize the code , and is a reasonable trade-off for loggers that I won’t be seeing again for several years, but if I have to swap some components at that time, I’ll need to do another calibration.
The other factor is that every time you introduce one of the many possible corrections, you necessarily limit your final output to the stability, resolution, or number of significant digits in that correction. In one case the limits of my rail voltage reading method produced random spikes in the record whenever that factor in the calculations had a brief toggle:
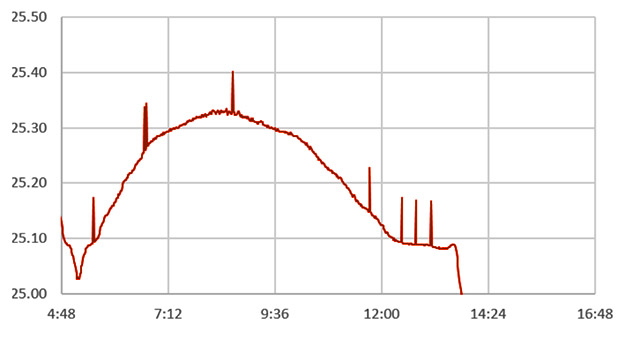
Note: spike errors are also diagnostic of calculation errors due to over-running your variables. The difference is that variable overflow problems are not random like the one shown above. They repeat regularly whenever the data passes some threshold in the calculation.
In more extreme cases this noise shows up as a overall thickening of the output from correction factors that toggle their relatively low-rez bits more frequently. As an example I did some runs where I took a Vcc reading with the internal bandgap trick, and rolled that into the thermistor calculation to improve the accuracy. the net result was that the 4-digit Vcc reading placed a limit on the final output so that there was no “effective difference” in the thermal resolution between oversampling at 15bit & 16 bit because that VCC correction had been included. (Note: You’ll run into this problem more often if you change aref voltages and forget leaving enough time for the aref capacitor to stabilize…)
The Arduino’s reference (and ADC) do not have a zero tempco. However, if you make the “perfect” regulator/band-gap/ADC assumption the only limits placed on your resolution are the significant figures in your S & H constants. Even so, there are so many other factors at play here, that I suspect that you can’t use my pin-toggle oversampling technique to push the Arduino’s ADC much past 16 “effective” bits before some other limitation occurs. Then there’s the issue of long term drift of the various components and the fact that it takes over 200ms each 16-bit reading; adding about 20 seconds of CPU run time to my logger’s daily duty cycle. Remember that my goal here was a dirt cheap temp sensor that I could add to every logger with a modest accuracy in the 0.1-0.2C range. If you need both resolution and accuracy, then you should switch to ratiometric measurements, with an instrumentation amp like the INA826, and a 24bit ADC.
Addendum 2017-11-05
Looks like Sensirion’s new STS35 has ± 0.1°C accuracy like the si7051 I’m currently using as a calibration reference. Since the Steinhart-Hart” equation has a built-in error of ~0.1°C and the si7051 ref is ~0.1°C, that might get me into the ball park of ±0.25°C accuracy. Hopefully that shows up on Tindie soon. Of course, it’s important to remember that we’re miles away from a real ITS-90 level calibration with a triple point cell.
Addendum 2018-03-14
I recently found out about a method using temperature-sensitive liquid crystals as thermal calibration references at 55, 75, and 90 deg°C. These were custom-made by Hallcrest UK (www.lcrhallcrest.com) and apparently the transitions were sharp enough to resolve 10 mK..? That’s still a bit rich for my blood, but I also thinking about experimenting with virgin coconut oils (on amazon) which melt at ~24 °C – the actual value is imprecise, but hopefully will remain constant for a given batch of oil. So could provide a nice melting point plateau…we will have to see…
Addendum 2018-06-10
Still hunting for a good method to provide nice thermal plateaus for the calibration runs covering >30°C of range. The refrigerator gives a nice 5°C point, and of course room temp is easy, but getting that third calibration point up at ~35°C is a bit trickier because I want that peak to be long and slow. In the winter that’s available on the house radiators, but during the summer I don’t have a ‘slow’ dry heat source in the right range. I’ve been following some threads suggesting that you can convert a regular water bath into a “dry-bath” with copper coated BB shot, or aluminum pellets. Both would be a heck of a lot cheaper than lab grade dry bath beads, though for an application where i am simply looking for a slow temperature ramp (so hot & cold spots don’t matter) sand or rice might suffice to provide the thermal mass I need. And I could use an old bath from eBay for the job – these sometimes sell for as little as $25 if they have surface rust on them. Or perhaps I could hack the temp sensor on a charity shop crock-pot to keep the temp really low….
Addendum 2019-03-25:
I’ve been developing a new method for reading thermistors with the Input Capture Unit on pin D8. Micro-controllers count time much more precisely than ADC’s measure voltage, so this new approach delivers more resolution than 16-bit oversampling in about 1/10th the time & power. The ICU also lets you use a single diode as a temperature sensor.
Addendum 2024-04-20: A practical method for calibrating NTC thermistors
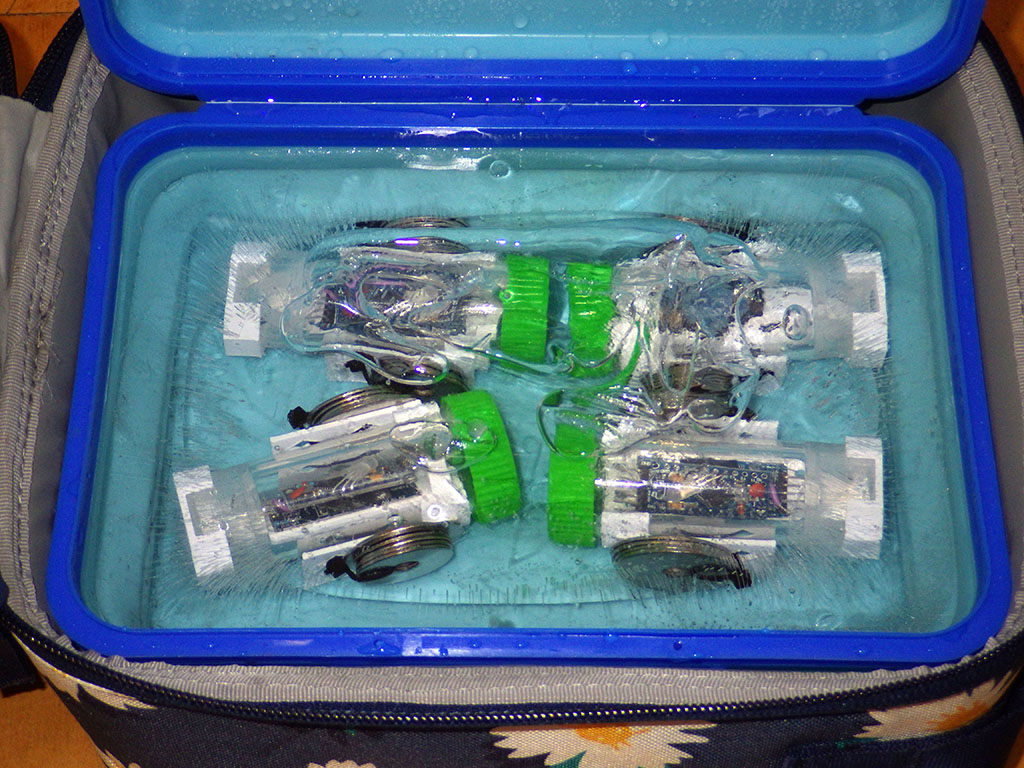
We have developed a new two-stage calibration method that is different from the ice-cube & boiling water that people often use. The first procedure puts the loggers in distilled water, inside an insulated lunch box and freezes it overnight, using the thermal plateau just after ice nucleation as the 0C calibration point. While this takes longer than the traditional ice-slurry it can be done in a batch process.
The second warm calibration point is gathered with a hard-sided lunch box warmed by an 8 watt reptile heater pad. These sell for about $15 on Amazon and because they don’t cycle, they give you the kind of nice smooth curve needed for calibration. The third temp/resistance pair is gathered in the same kind of insulated lunch box that is simply left at ambient room temp.

As far as I see, the Si7051 only has a accuracy of +/- 0.1C in the temperature range 36C to 41C, outside that it lowers to +/- 0.25C. It is clearly intended to be used in fever thermometers. (human cavities ;-))
The side note (on page seven) specifies three range/spreads:
±0.1 °C: +35.8 °C to 41 °C;
±0.13 °C: 20.0 °C to 70.0 °C;
±0.25 °C: –40 °C to +125 °C.
Since my target environmental range is 20-30C, the si7051 is still better than the other sensors I’ve found in its price range. But I completely missed that note, so now I wonder if I should be using it to calibrate over the range from 0 to 40, when that involves jumping from one tolerance to another? I will have to do some testing to see how these sensors stack up against my Thermapen reference.
I’d do some more testing, but as you said, they are still very good. I assume all Si705x chips come from the same production line and are selected on accuracy. Only after that the last digit is added to their name. What they are not, is user (hobby) friendly with the DFN6 package. How did you connect them? Did you make a printed circuit for them, buy a breakout board or solder wires directly to them?
Closedcube sells the Si7051 with a breakout board on Tindie, and provides a basic library:
https://www.tindie.com/products/closedcube/si7051-01c-max-digital-temperature-sensor/