

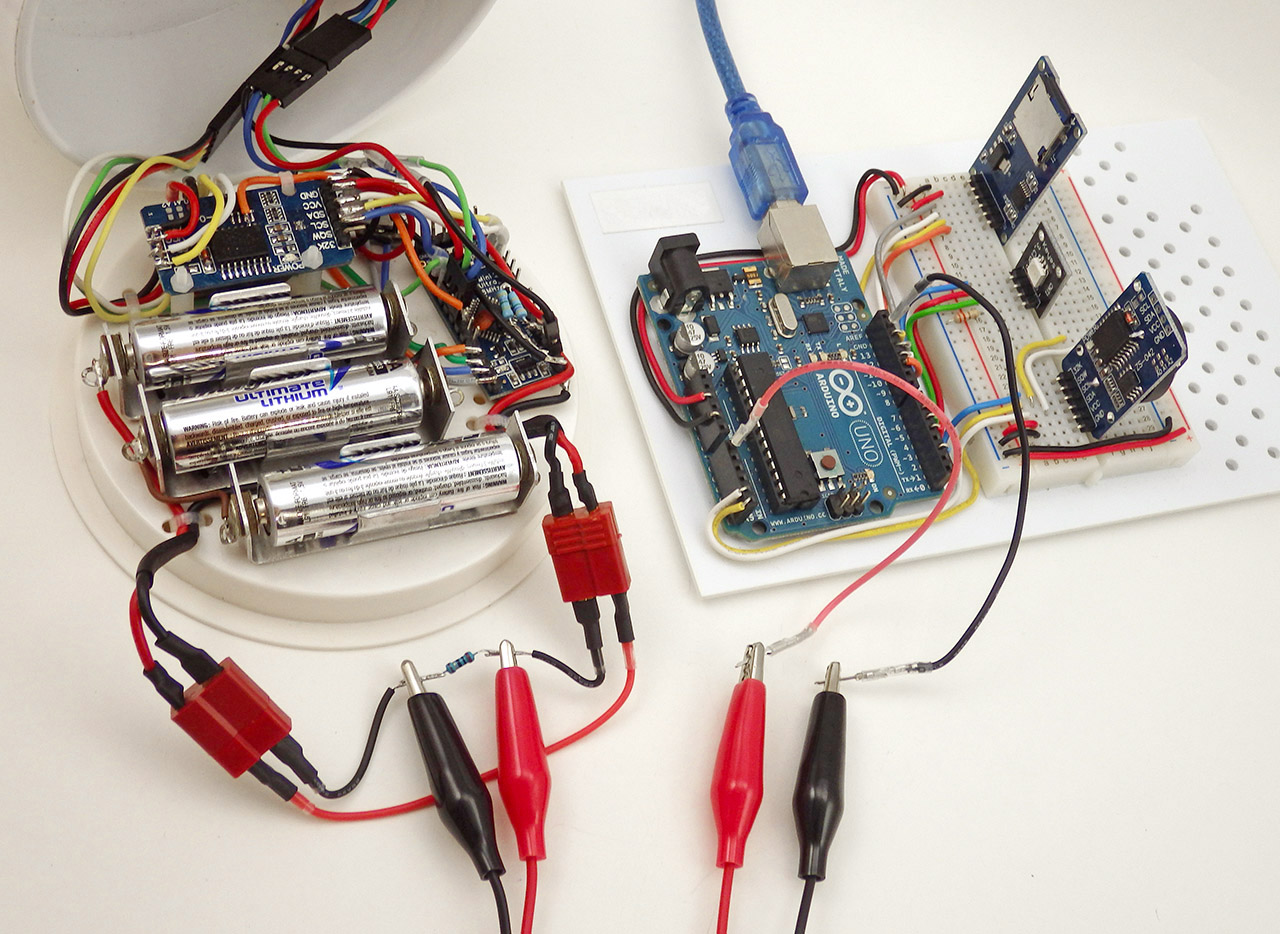
Here, I’m using the basic UNO Logger as a tethered Data AcQuisition device, recording the current used by a second data logger. Since the second logger is ‘floating’ with no connection to the UNO’s ground line, the voltage drop across the 5Ω shunt resistor is recorded using a differential channel on the ADS1115. Differential readings are also useful for sensor applications that use a wheatstone bridge arrangement.
I recently picked up a ADS1115 breakout board, and it was fairly easy to use that with the serial data plotting capability of the Arduino IDE. It’s not often that something works this well on the first try, and I thought I would post about using the combination as a kind of ‘poor mans oscilloscope’. The plotter’s vertical axis auto adjusts as the value of your output increases or decreases, while the X axis is fixed at 500 points, with each tick of the axis equal to an executed serial println command. Having the ability to spool data to the screen with a simple print statement, turns the exercise into a “What happens if I do this?” kind of process, which is perfect for providing feedback to students learning how to program Arduinos. I posted the code used to generate these graphs on GitHub, but you will have to noodle around with it to figure out what the threshold settings should be for your particular application.
Although I already have a good method to estimate the overall power consumption of my loggers, I was motivated by this Jeelabs post to see if there was a way I could look at individual events. Even if you have a nice Rigol to play with, it can still be tricky to get all the settings and timings right because the loggers can draw anything from 0.15mA while sleeping, all the way to up to 100mA during SD writing events. Jeelabs elegant solution to this ranging problem uses two shunt resistors and a diode, but with 15bits of differential range on the 1115, the 8x gain setting can do the job with a single resistor. (…provided I don’t exceed the ±0.5 volt limit that PGA setting imposes…)
After installing Rowbergs I2Cdev library, and running a couple of jumpers, my drip sensors were generating raw count output like this:

Of course that was scrolling by like crazy, and the re-scale feature meant that the y-axis was jumping round like a bullfrog on a hotplate. You can bring the vertical axis under control by adding a few delimiter separated constants before the final data println:
Serial.print(4000); Serial.print(” “); // sets a stable upper value line
Serial.print(0); Serial.print(” “); //this constant sets a stable lower value
But to prevent the x axis from scrolling forever, I had to setup a trigger threshold, that would only capture a new set of readings when an actual event was occurring:
void loop(void) { int sensorOneCounts=adc0.getConversion(); //note we already set the mux to differential in setup if(sensorOneCounts >= LoopThreshold) { //rapid sampling loop to capture the event start=millis(); for (int Cycle = 0; Cycle < ADCcycles; Cycle++) { currentADCreadings[Cycle]=adc0.getConversion(); } elapsed=millis()-start;// elapsed gives you the timebase for your samples } //A separate loop to output of the samples to the text monitor or serial plotter for (int Cycle = 0; Cycle < ADCcycles; Cycle++) { Serial.println(currentADCreadings[Cycle]); } #ifdef ECHO_TO_SERIAL //TEXT only output of the time it took for your data acquisition loop Serial.print(F(“Time for “));Serial.print(ADCcycles);Serial.print(F(” readings: “));Serial.print(elapsed);Serial.println(F(” milliseconds”)); #endif } |
A few runs with text-only output showed the sleeping logger generating around 65 raw counts on the ADC, so I set the LoopThreshold to 75, and the plotter started behaving like an oscilloscope’s triggered sweep: scrolling 500 new readings across the screen each time the drip sensor woke up. With a known shunt resistance, and the millivolt resolution per bit from the datasheet, I could convert the raw ADC counts to μA in the printing loop. Just for fun I also tried speeding up the I2C bus to see the temporal resolution of that sample loop at 400Khz:
 So I was asking for data faster than the 1115’s top speed of 860sps could deliver it. A few more trials showed that even with the Arduino’s default 100Khz bus, I had to add delayMicroseconds(400); into the capture loop to keep the UNO from outpacing the ADC module. I expect that will be different for Arduinos with different clocks like the promini, so one would have to make manual adjustments based on the elapsed times for each system.
These drip logger events are the result of straightforward code that follows the steps:
1) Wake from interrupt & clear the registers, update count variable
2) Turn indicator LED on & sleep for 15ms
3) Wake, turn LED off & sleep for another 32ms (to let impact vibrations die down)
4) Set accelerometer registers & go into deep sleep: wait for next accelerometer interrupt
Since you can drop as many constants on the plotter as you want, it’s easy to determine the current level at a specific point on the plot by intersecting it with a new line:

Though there were no surprises in the pattern per se, it was handy to find out that the “in-event” sleep current was about twice the normal standby state. (which I confirmed at 0.2mA using a DMM) Now I can go digging through the code to figure out what’s drawing that extra power.
After resetting I2C bus, I tweaked the delays to exactly match the 860 sps output from the ADC. Then I sat back and waited for one of the real time clock alarms to fire:

This was my first view of that complex logger event, with variable juggling, time stamp creation, eeprom buffering, counter resets, etc. With I2C devices being able to stretch the clock whenever they need to, I had no idea how long these kind of events actually took, and I certainly never managed to capture one so easily on the old clunker scopes I could get my hands on. The comb pattern you see there is a result of sleeping the processor for 15ms after sending data to I2C device registers; instead of using a 6ms delay while the Arduino waits for the devices to respond. This lengthens the overall duration of the event, but the time spent running at full power is reduced.
By how much? I reset the logger to use delays after I2C writes rather than sleeps and re-captured the event:
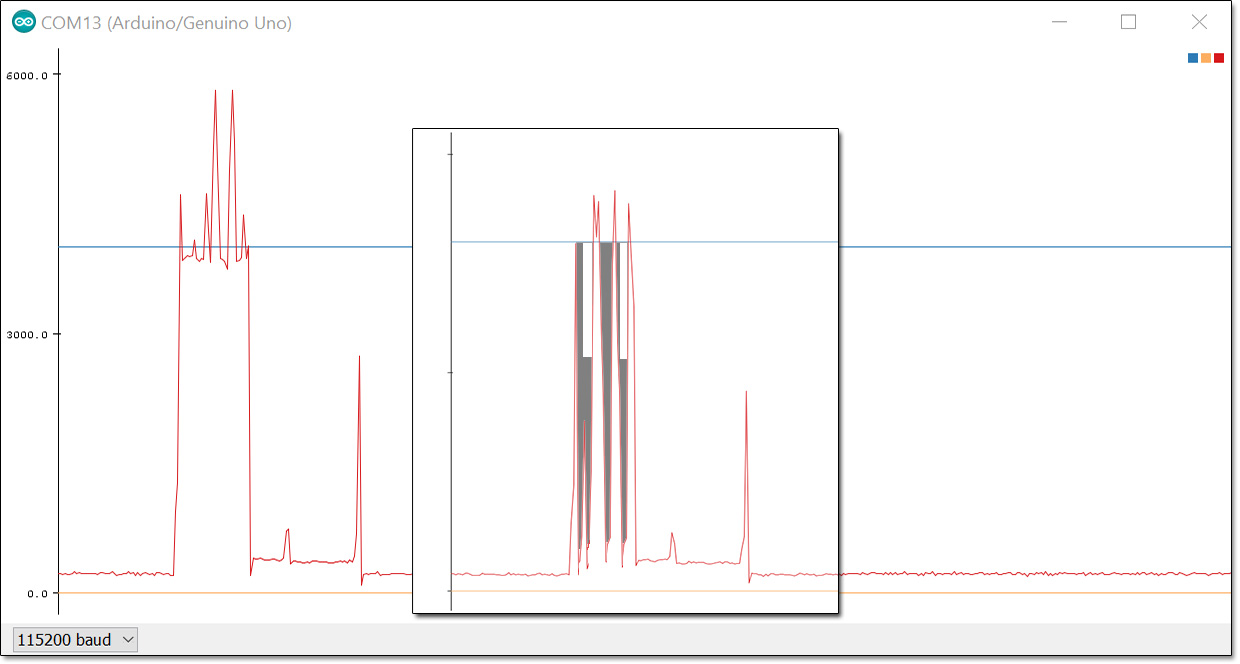
The horizontal axis is at the same scale as before. The start of the event now looks like a solid block and the overall event is about 50ms shorter. For comparison, I’ve inset the previous graph with the sleep gaps cut out and the spikes moved together, and the two white rectangles at the top represent area equivalent to sleep gaps that were removed. The grey area shows the power saved by using 15ms sleeps instead of 6ms delays. To do this properly I would need to take another reading of the 3xAA power supply voltage and calculate the total power used (minus the loss on the shunt resistor), but you can see at least 25% improvement simply by comparing the plots. That kind of feedback is very helpful when you are trying to optimize your code.
Now, I can already hear people scoff that even $3 is too much to pay for a scope that won’t reach 1Khz. Indeed, with a minimum temporal resolution of just over a millisecond, the ADC frequently misses brief current peaks. I know my 8mhz promini based loggers usually draw more than 4mA while running, and you see the longer operations in the RTC/delays event pushing up towards 6 mA.

But even with the upper third lopped off those spikes by timing errors, I can still use this method to make a reasonable estimate of the power being consumed by logger events provided they don’t last more than 580 milliseconds. ( The serial plotter provides a window for only 500 samples and the UNO barely has enough variable memory for a 16bit integer array that size.) If you add the SD card library to your script you are only left with enough memory for about 100 of these samples in your capture loop, although you could try reducing the ADC readings down to 0-256 with a well tuned map function. Then you could use an uint8_t integer array, and store twice as many readings in the limited variable memory of the Arduino. If you were just doing a classroom demo, that range would probably still give you a decent display on the plotter.
Despite these limitations, the setup is so simple that I think the serial plotter tool will become a go-to for quick looks at sensor data, perhaps even replacing some processing based demos. The ability to connect four of these ADC modules to a single Arduino makes the platform look quite respectable as a classroom level data acquisition system, especially for environmental data that rarely requires high frequency sampling.
If you switch to a beefier 1280 based Arduino like the Mega, or the Moteino, those memory limitations disappear and recording much longer events would become possible. With the delays I had to put in, my gut feeling is that you could juggle a couple of these boards at a time; interleaving the readings to double or triple the effective sampling frequency. (at least until the input impedances start to mess with the shunt resistor…) And finally, I think adding a couple of well chosen diodes to clamp the input voltage to the ±limits imposed by your PGA setting would be a good idea in the classroom, or you might loose a few of those ADS1115 modules.
It is worth noting that there is a comparator function in the ADS1115 that can be programmed to send a pin change alert when a given threshold is crossed. If I can figure out how to get ADS1115’s built in comparator working with the differential modes, this would even let me put the DAQ to sleep between sampling runs. The ADC module also has a ‘data ready’ alarm that can be enabled to tell you exactly when it has the next reading available. I did not go that route as the generic approach used here is applicable to sensors without these features, including the ADC built into the Arduino.
There are plenty of other serial data plotting programs, but using the free IDE version like this is an iterative exercise, forcing you to switch between the serial text monitor & the serial plotter a few times to tweak the delays and constants. If you are using an UNO in a classroom setting, this in itself is a useful activity. And given how cheap basic DAQ modules are these days, choosing to use an Arduino is always about the showing the process rather than just getting a final result.
Addendum 2016-08-15: A MUCH faster DAQ with the native UNO ADC
Here I’m reading the voltage across a 10Ω resistor with the UNO’s built in ADC. To do that I need to join the ground lines because the Arduino can only take single-ended readings. That also forces me to put the shunt resistor on the low side line so I don’t exceed the 1.1 vref. This arrangement causes the promini logger’s effective ground line to jump around as the current through the resistor changes.
The folks over at Measuring Stuff posted a page called The Arduino DAQ Chronicles, which goes into some detail on the process. It’s a good chunk of background reading even if you are using the ADS1115 ADC described above. The Arduino’s native ADC delivers 10-bit readings, (ie 0-1023) and compared to the relatively pokey ADS1115, a typical UNO can take several thousand analog readings per second; outperforming the ADS1115 by a fair margin. The challenge is balancing the reduced resolution with the other limits imposed by the method itself. Even if you increase the sensitivity of the native 10-bit ADC by changing to the internal 1.1vref, you only reach 1.1v/1024 steps = 1.07 millivolt per bit. Remember that my loggers are sleeping at 0.2 milliamp x 5Ω shunt resistor = 1 millivolt so we are operating right on the lower limit of the ADC resolution. With that 1.1v cap on the ADC input, and a potential 100mA peak current (during SD card data saves), the largest shunt resistor I can use is 1.1v/0.1a= 11Ω. So to get the Arduino to discriminate the low currents we need to use a pretty large shunt resistor value, and allowing the voltage drop to get that high imposes another challenge in that the drip logger would only be left with 4.5v (the 3xAA battery) – 1.1v drop on shunt = 3.4v. That’s right at the minimum input voltage needed by the 3.3v regulator on the Arduino promini board, risking a potential brown-out in the middle of the SD card writing process.
But hey, lets pop in some new batteries, and see what we get:

Not too bad, but that’s a noisy plot with lots of jitter on the base line. Having 1-2 bits toggle like that is typical for ADC’s so there is probably nothing I can do to get rid of it. And the drip sensors resting state reads at zero when it should be registering at least two counts. It is also common for an ADC to under or over read by a few bits, so I added an offset adjustment into the code to bring that sleeping baseline up to the 0.2mA that I have already confirmed with a multimeter.
Then I realized I still had the 400us delay in there from the ADS1115, so I took that out:

Crikey! Even with the code overhead, that thing is taking over 8000 samples a second! That’s far too many readings for the serial plotter to handle if I want to view long events. And that first spike goes upt to about 5mA – exactly where it should have been on the ADS1115 readings if that module had not missed them at 860sps. So how do I maintain the Arduino’s ability to spot those rapid sample peaks, but only send 500 readings to the screen?
Instead of delays, I decided to create an “oversampling loop” that creates a running average using a low pass filter, but also checks for peaks throughout the process. You can dig into the code for this over at GitHub, but the basic idea that is if a peak occurs, then the highest reading in an interval becomes the final reading. If a decreasing trend is found, then the output from a leaky integrator becomes the final reading for that interval. So the readings get smoothed on the way down, but not on the way up.
Here is a try with the oversampling interval set to six ADC readings:
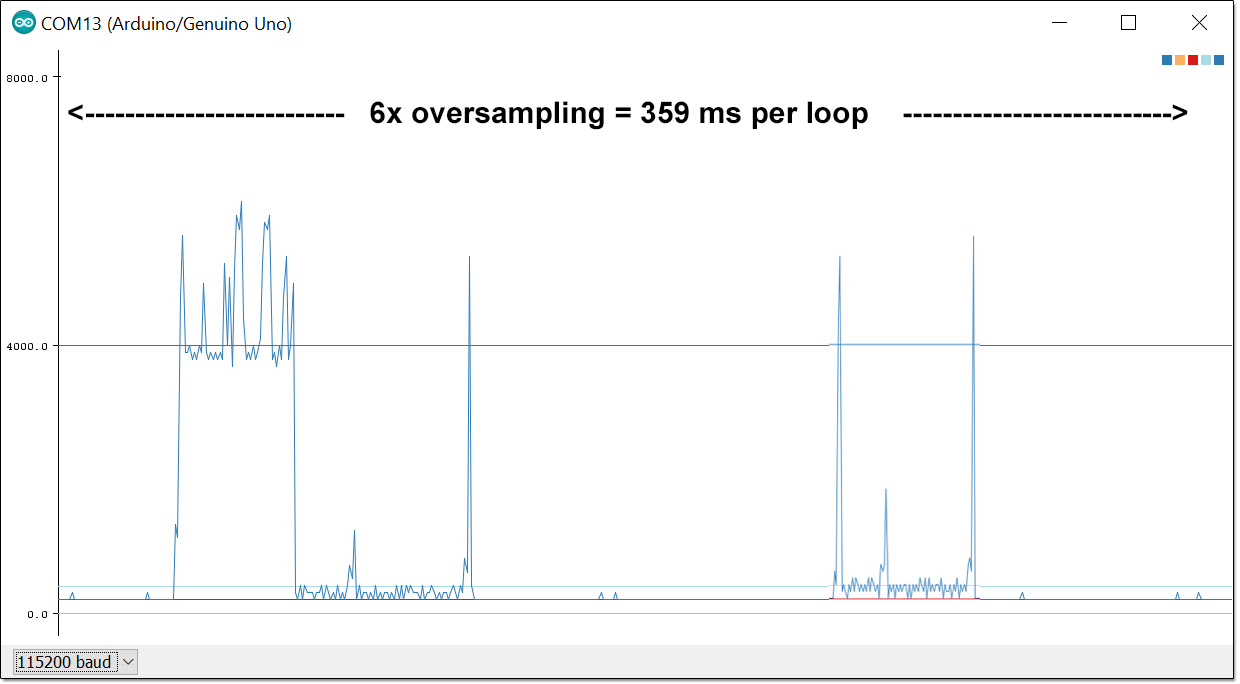
That’s the RTC event (with delays) and the drip triggered event at the same scale.
Now here’s another run with a 15:1 ratio:

Squashing more than 7000 raw readings into a 500 line display really starts to distort the curve, but everything is still recognizable, and more importantly, the peaks did not get chopped off like they did with the ADS1115. Woot!
Now we have a method that lets us adjust the serial plotter’s display to match the event we are trying to see, provided we don’t over-interpret the accuracy of those heavily averaged interval numbers. And rapid sampling can introduce other issues to deal with. For example: Dustyn Roberts has a useful post on creating very precise time stamps with the micros(); function when you are sampling faster than 1 millisecond.
So within limits, a standard Arduino gives you good temporal resolution but can not detect less than 1 millivolt of change, while the ADS1115 gives you precision down to an impressive 0.0078 millivolts (@16x gain) but is not so great for tracking really brief events. If you need both resolution & speed, you need opamp circuits designed for the specific situation, as in the Jeelabs example. It’s also worth mentioning that the Arduino ADC also supports a comparator that you could use for the threshold function more elegantly than I’ve done here. And with such a low impedance input, you can also double or triple the sampling rate by changing the ADC clock prescalers (this is also in the code on GitHub) Both of those things are described in detail over at Nick Gammons excellent page on ADC conversion on the Arduino.
Addendum 2016-08-16
Hopefully they will add export options (like other serial tools) to the plotter in the future, but for now you can manually copy data out of the serial text monitor and paste it into Excel. Before you start a long run for export to a spreadsheet, comment out the constants that you were printing to stabilize the plotters y – axis, so that only the numbers you are interested in are sent to the serial output. If you are waiting for an event to happen, it often helps to add a threshold test so that the serial monitor is not just filling up with uninteresting data that you would have to prune away later anyway:
Then after your DAQ has been capturing events for a while, click inside the serial monitor window, select all the data & copy it (on a windows machine that would be [CTRL]+[A] followed by [CTRL]+[C] ) then open a new spreadsheet and simply paste the data into an empty column.
This lets you compare the events side by side:
 If you want to graph more than one number, then add a comma between them with Serial.print(“,”); remembering to use println on the last variable being sent. Then you need to add the intermediate steps of pasting the data into a text editor like notepad, and saving that text file. Then change the ending from .txt to .csv and Excel will open it directly. If you can’t change the filename, you can still import the text file and specify comma delimiters:

to put the numbers into adjacent columns. If you don’t have excel, there are plenty of other data plotting options out there. And programs like coolterm, can save you from having to do those cutting & pasting steps.
Addendum 2016-10-13
Gokul Shrinivas just posted a neat little bit of code at hackster.io that reads the Arduino ADC at a cracking 68k samples per second out of a Arduino Due by directly accessing the ADC ports as soon as the DataReady interrupt is triggered.
He starts with defines:
#define ADC_MR * (volatile unsigned int *) (0x400C0004) /*adc mode word*/
#define ADC_CR * (volatile unsigned int *) (0x400C0000) /*write a 2 to start convertion*/
#define ADC_ISR * (volatile unsigned int *) (0x400C0030) /*status reg -- bit 24 is data ready*/
#define ADC_ISR_DRDY 0x01000000
#define ADC_START 2
#define ADC_LCDR * (volatile unsigned int *) (0x400C0020) /*last converted low 12 bits*/
#define ADC_DATA 0x00000FFF
And the sampling loop becomes
ADC_CR = ADC_START ;
  for (i=0; i<320; i++){
    // Wait for end of conversion
    while (!(ADC_ISR & ADC_ISR_DRDY));
    // Read the value
    analog_data[i] = ADC_LCDR & ADC_DATA ;
    // start next
    ADC_CR = ADC_START ;
  }
He used an LCD screen for the scope, but I am wondering if it would be possible to refine my oversampling trick to squeeze that many data points on the serial plotter somehow…
And I wonder if this trick is even available on the 328p? I guess I will have to go looking at other Arduino Oscilloscope projects. The problem is that most of them seem to be using 8-bit signals from “free-running” modes, and I rarely have an application that needs less resolution. Here’s a project doing Interrupt-Driven Analog Conversion with an ATMega328p, and Nick Gammon mentions it here, but no one does a speed comparison with the ten analog 10-bit readings you get per millisecond using plain old analogRead();
Even if there is no speed gain, perhaps I could do calculations while I was letting the ADC read continuously to speed up the overall sampling loop. I could see myself getting out of sync pretty easily though, unless I deactivate the general interrupt flag and activate it again (with cli() and sei()) or I would randomly miss readings.
Nick posted a code example of reading the Analog-to-Digital converter asynchronously that seems to solve the synchrony problem. He’s also posted an interesting ‘sleep during ADC conversion’ example buried in there, but that’s only useful if you are not using timers & PWM at the same time, and I often do that…
Update: the Hackster.io project listing magically evaporated… and I just found exactly the same code at Bruce Land’s Hackaday project from 6 months ago. So I think proper attribution for the script above should go to Bruce.
Addendum 2017-01-10
I’ve been playing around with the ADC clock prescalars, and with the asynchronous reading code available over at Nick Gammon’s site to try to get better temporal performance out of my little UNO-scope. With such a low value shunt resistor the ADC seems to read fine even if you crank it up to about 40k samples/second. Unfortunately you pass a point of diminishing returns due to the processing overhead with the interrupt based asynchronous readings, so async reading actually reduces the number of readings per millisecond at the higher clock speeds. If you want to play with this approach yourself, I’ve posted the update with the prescalar settings to GitHub.
Addendum 2017-02-27
Anyone interested in using an Arduino as at data acquisition device will probably want to see my recent post: Enhancing ADC resolution with Dithering & Oversampling
For an unmodified UNO, Qwerty’s triangular dither method is probably the easiest one to use, but for 3.3v boards I’d go for the Toggled pin dither method I outline at the bottom of the post.
Addendum 2019-09-27
Microsoft has added a ‘data streaming’ plugin that’s free for Office 365 users which will accept data directly from an Arduino. If you are a student, the 365 software itself is also free. But for those of us running older versions of Office, the cut and paste method described above still works fine.

Hi, thanks a lot for your great articles.
I want to comment two things:
1. one serial plotter software that I think it is and will be great.
https://hackaday.io/project/5334-serialplot-realtime-plotting-software
2. Do you think that with a ATMEGA32U4 (I have a Xadow Board, but it can be a Leonardo or ….) could you overtake the 115200 bps limit of the serial protocol so you could reach more than a 1kHz oscilloscope ?
Regards,
The “take a snapshot” feature is the one big deficit of the IDE plotter, and will be enough to make me investigate that new plotter. Though with dataloggers you need a “threshold” feature to go with it to catch flaky code triggered behaviors. WRT the scope, I have not looked into how the clock is set for the internal UART on the 32U4, but my expectation is that impedance/capacitance is as much a factor as the clock.
Thanks Edward.
I almost don’t understand you ( 😉 cheers).
The datalog software is great, and there will be improvements in near future.
What I will try to do is to improve the UART communication to have a continuous scope so I could forget about threshold. It depends on what SPS (samples per second) do you need.
There is the ADS1115 with these great features: 860 sps, -0.256V to +0.256V with 16 bit, or 0 to +0.256V with 15 bit. With a shunt resistor of 1 ohm you could measure until 256mA down to 8uA (32768 values), so you can record both sleep a wake times, a dropout voltage of 0.256V doesn’t hurt. Also, with a 0.1ohm resistor, from 0.8uA to 25.6mA. ( I understand that probable the real resolution will be about 16 o 24uA, or 1.6 to 2.4uA)
May be 860sps is very slow for your needs. My need is to get an aproximate time of the peaks and their waste. For checking perfectly the peak, you can also use after an arduino with 10 bits and 8000sps and an smaller shunt resistor to get the peak perfect.
What we need is not to depend on the threshold and send throught UART as much as data that we can.
Our limit is the UART bps, with 115200 bps (I don’t know exactly, but I think that I have to divide by 11). 115200 bps –> 10000 bytes per second (aprox), Let’s continue with 8000 bytes per second.
If you want to send integers, you will be able to send through UART aprox 4000 values per second.
That is not a 8k sample rate, but it is 4k sample rate. Is it not enought to register your peaks ?
As you say, we can also make a 8k sample rate with arduino ADC but only send data once a milisecond with the HIGH value and MIDDLE value of that 8 samples of that milisecond.
What do you think about it ? What is the sampple rate that do you think we need to log that nrf24’s peaks ? esp8266’s peaks? arduino’s peaks? ….
Regards
NOTE: Sorry, but my comments are not very precise. Yours are much better !!!!.
I like the ADS1115 for it’s differential reading capability, but I found it was just too slow to monitor the kinds of current spikes you get from data logger operation. But every sensor application is different, and my current work on conductivity sensing, I’m using oversampling to give me better resoltion from the Arduino’s ADC than I’d get from the ADS1115, but at the cost of even more time. I’ll get that stuff posted once I’ve sorted out the calibration.
Pingback: Switching off SD cards for Low Power Data Logging | Underwater Arduino Data Loggers