

The Thermapen tip fits reasonably well into a 9/64″ hole, and that size also makes a good pilot hole for the 1/4 inch DS18 wells. The travel on my little bench-top drill press is only two inches, but that turned out to be the perfect depth. The whole job took about 4 hours, with less colorful language than I was expecting.
The high residuals I was seeing up at 40°C, and the dubious waterproofing on those cheap DS18b20‘s convinced me that I needed a dry well for the calibrations. Since lead has a thermal conductivity 100x better than water, my first though was to populate a tin can with short lengths of copper pipe and fill the spaces in between from my solder pot. But I was unable to find exactly the right internal diameter of piping for the tight fit I wanted around those sensors, and the charts indicated that aluminum would give me 1/2 an order of magnitude more thermal distribution. So despite the fact that I had no experience working metal like this, I ordered a 4″ piece of lathe bar stock from eBay (~$15).

Go to a 530GPH pump if you have a larger water bath. The aluminum and stainless steel contact point suffered a bit of galvanic corrosion at first, but I separated them with a plastic plate and it seemed fine after that.
It took me a while figuring out how to lubricate the bits: basically you can never have too much cutting fluid at small diameters, but you can use the big 1/4″ bits ‘dry’ once the pilot holes are in. Just lift the bits frequently to clear the shavings so things don’t heat up and bind. And yes, new high-temp drill bits will cost you more than the aluminum rod – but it’s worth it. The 3″ diameter rod gave me enough room for 38 DS18’s with a few different locations for the Reference Thermapen probe. The next addition to the process was a 1200L/h aquarium pump (~$8), which created a vigorous circulation in the five liter reservoir. So now I have a setup were the clunky old water bath provides a big lump of passively cooling thermal mass, while the sensors and my reference thermometer are held together by the conductivity of the aluminum block.

The full DS18b20 calibration rig, with ~10x1m sensors in what is essentially a star configuration via the intermediate breadboard. 2k2 pullup resistor.
With those new additions, re-running the 100-ish sensors I had on hand produced curves so smooth that it was easy to spot my own procedural errors ( when I did not wait long enough for the Thermapen to equilibrate ) because the DS18 curves had considerably less of the random scatter I had seen in the water-only runs:

After removing the bad reference readings I generated the same series of y=mx+b fit equations as before, only this time I did not use a graph trend line to generate the constants (described in the previous post) but instead used the slope & intercept functions in excel. This lets you copy and paste the equations from one data set to the next with a macro which dramatically speeds up the process when you are chugging through more than thirty sensors at a time. It also adjusts & recalculates dynamically when you delete a row. Convert your reference thermoenter readings from Celsius into the equivalent 12-bit DS18b20 reading by dividing by the DS18’s resolution of 0.0625C
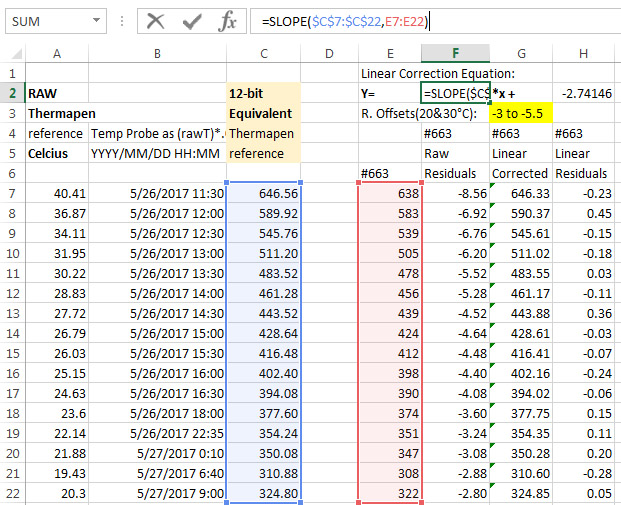
Now that the sensors were really were being exposed to the same temperature, I could use the raw and corrected residuals to prune the reference data even more by rejecting any single reading anomalies that made it through the first pass: ( residual(s) = reference – DS18 reading)

It’s quite an improvement to be able to use the DS18 output to polish the set because in previous tests (without the dry well) the high temperature residuals were so variable that it would have completely masked this kind of problem.
Using the groomed reference points, it’s easy to see which sensors make the cut:

With LSB points on the y axis of those graphs, the corrected residuals for a good sensor fall into a tight band between ±0.5 LSB. The bad sensor on the right has a huge spread, and was immediately tossed in the garbage. In theory at least, I’m achieving calibration accuracy better than the sensor resolution of ±0.0625°C. It would be a bit bravo to claim that, but I am confident that we reached the ±0.1°C target that I wanted for our field sensors, without doing a full laboratory level temperature sweep.

With only one or two exceptions, these sensors under-read. Of about 100, the largest group was (-3 to -5) LSB points with 12 sensors, followed by (-4 to -6) with 11 sensors. A small handful of sensors had consistent offsets with no slope, and only two sensors had positive slopes in their raw residuals. Overall, I rejected about 30% of them for one reason or another. To get really sweet sets, it’s a good idea to start your project with about twice as many sensors as you think you are going to need, from 3 or 4 different vendors. (though the ones from Electrodragon provided the highest yield…)
Another benefit of all this work is that I can now group my sensors using the raw residual trend-line values at both 20 & 30°C. (see top left graph for #328 above) This captures both the offset and the slope information, and by matching slopes I can assemble strings of sensors who’s uncorrected behavior does not diverge. With the calibration corrections already in hand this might seem unnecessary, but experience has shown that being able to quickly spot trends in the raw data can be very handy in the field when you need to make on-the-spot decisions about a deployment. I can also add that the sensors from different suppliers showed strong clustering in these groups, implying that production run biases would introduce an offset into group normalization methods (ie: without a reference thermometer to compare them to) unless you bought them from several sources.
So our temperature chain system is maturing nicely, and in a pattern that is becoming familiar, it took three generations to reach the point where I think my DIY builds could be compared to commercial kit without looking too shabby:

As time goes on I am reducing the number of interconnects to improve reliability. But even with the chain segments sporting more sensors, I only put twenty four nodes on a given logger body. As my wife already calls the all white flow sensors ‘storm-troopers’, I added a touch of ‘vader black to spruce up the housing. Hopefully, the force is strong in this one 🙂
Of course these guys still have to prove they can last a year under water, so for now we will continue with dual deployments (which we usually use for new prototypes) in case one drops out on us.
I’ve only got solid power usage data from one of my 24 sensor chains at the moment as everything else is still out on deployment. On those early units, I had no idea what the total usage would be so I just packed in 12 AA’s. (4 banks x 3 in series) After the over-voltage burn down, the discharge curve settled to a steady 100mV drop per month. That unit had 24 sensors, taking 12-bit samples every 15 minutes. My current builds have only 2x 3AA banks, so I expect them to drop by about 200 mV per month. A low input cutoff of about 3.4v on the regulator means that I will probably get 5-6 months out of a fresh set of six AA’s. Driving the DS18’s at their maximum resolution (ie: 24 x 1.5mA x 750ms =~27 mAs /sample), I think we would only make a year on 3AA’s if I moved the interval out to once per hour.
With respect to quality, the real test will come in post deployment testing when we find out how much these sensors drift over time. And I am really keen to see how the units we deployed across that hydrogen sulfide layer performed, as that chemistry is far from benign. If they prove hardy enough, we might even bury a few and see how that goes. In harsh environments, every choice you make in the build is a cost/time-to-failure trade-off.
Addendum 2016-03-07
[jboyton] over at the Arduino.cc sensors forum pointed out that you could save the $200 cost of the Thermapen by using an Ultra Precision Thermistor from U.S.Sensor that offers ±0.05°C accuracy right out of the box. These 10K NTC units can be purchased from Digikey for ~$10 each. You could epoxy that sensor into the same stainless steel sleeves used on the DS18’s and be ready to go. The cool thing about this idea is that the reference readings could then be taken on a logger, avoiding those mistake-prone manual readings. Definitely going to look into this …
Addendum 2016-03-10
I’m doing post assembly water bath checks on the T-chains now. I had some lingering questions about whether epoxy contraction, or the heat I used in the process of making the string nodes, would throw off the calibration:

#74 was included in this group by accident…
You can see how closely matching the 20 & 30°C offsets groups the raw readings into a fairly tight 3-point band even though the sensors are now distributed around the water bath. Applying the linear correction reduces that to 2pts, and shifts them all up towards true temp. With the spread approaching the bit-toggling level I suspect I’ve reached the point of diminishing returns, so I’m calling this set ready to deploy without further normalization.
Addendum 2016-03-11
Segments 19 & 20 were constructed with some of the most stable sensors from that round of calibration, at least with regard to the corrected residuals. But I did not have any other groups large enough to build the next few sets from DS18’s with identical performance, so I loosened the criterion out to ±1 LSB, and started combining different offset groups on the same chain (mixing the sensors randomly so no trends would be introduced…)
The mix ended up producing graphs like this: (click images to enlarge)
 The raw variability now crosses 10 points, and after you apply linear calibration you are still left with a 3-4 point spread depending on where you are on the curve. So while the group as a whole should still be accurate, I now face a question of precision. Having those sensors flop around by as much as ±0.15°C could mask some of the more subtle signals we are looking for, and this forces me to apply a round of group-normalization to get them into the kind of tight band I saw from the prime sensors:

This second Y=mx+b correction is based on the average of the post calibration readings (so should have no effect on the accuracy) and you can still see some spaghetti squiggles from the inherent noise in these b-class sensors. I was hoping that the new method would save me from having to bang ’em together like that, but apparently it depends on how fiercely you apply your selection criterion before getting out the epoxy.
Which reminds me that automating the calibration run (ie: using a high accuracy thermistor as the reference) would let me test many more sensors and build those matched sets with less time playing button-monkey. Of course, I’d also have to ensure that I’m not introducing other errors in the process with the way I handle the thermistor readings…
Hmmmm…
Addendum 2016-06-29
Now that I have several more of these temp. chain loggers under my belt, another issue has popped up that could be taken care of easily at the calibration stage: Sleep current. Sensors from some of the eBay vendors draw significantly more than the 750nA standby listed in the spec sheet. A ‘good’ set of DS18B’s doesn’t add significantly to your loggers sleep current, but a couple of lemons in the batch can raise a 12-node segment to between 0.1-0.2 mA for the sensors alone. This might explain how these cheapies get onto the grey market in the first place.
Addendum 2016-07-03
With the next generation of temp strings in production, I am still wrestling with the “diverse” sets assembled from sensors with widely varying behaviors. These continue to need a post-calibration normalization round to bring the group behavior together:

What’s twisting my melon is that it’s hard to know how much of the post-cal normalization is actually beneficial, and how much of it is just compensating for differences in water bath, since the post epoxy sensors are no longer pinned together by that block of aluminum…?
Addendum 2016-11-16
Just a quick note to suggest another step to overall procedure: Measure the sleep current of your DS18b20! Good ones auto-sleep at about 1μA, but I’ve had a few batches now that constantly draw between 40-60 uA each. This flaw was definitely vendor specific, so only buy a dozen or so from each to test them out before buying a large bunch. So far, I’ve had the best sleep currents with the $2.50 sensors from electrodragon, though their “waterproof” epoxy job is utterly pathetic, and the raw 20 & 30°C offsets are often just barely within the ±0.5°C spec. Also I have modified the script I use to gather the serial numbers so that it automatically sets the sensors to 12 bit every time it runs. That is the default resolution, but I found that one or two sensors from a given batch arrive set for lower bit depths. And finally, watch out for sensors that require parasite power turned on at the end of the conversion to operate properly even when they are being powered by all three lines. (ie: needing oneWire.write(0x44 ,1); rather than oneWire.write(0x44); ) I have never gotten parasite and normal mode DS18b20s to work properly as a mixed bunch. Stick with normal mode.
Addendum 2016-12-04
Usually I do these calibration runs with sets of 32-34 sensors, so all the holes in the aluminum block are filled. But I recently tried to calibrate a small batch of eight “naked” DS18b20s with the same method, and ended up with slope and offset calibration factors that were 1-2 degrees Celsius too low, as compared to my reference. I re-ran the cooling ramp with tape over the unused holes, and sure enough, the adjustments became much smaller, with the raw readings much closer to the reference. Air was getting in and cooling the center of the block where the sensors were. So if you use this method on a smaller numbers, use other DS18’s to plug up all the unused holes, and put tape over the used ones to prevent air circulation from depressing the readings for raw sensors. I hadn’t thought about it earlier, but the sensors themselves form part of the thermal mass of the system. Once you start calibrating, you will have more than enough ‘duds’ (with the cables cut off) to plug up those wells when doing a runs with smaller numbers of sensors.
Addendum 2017-01-18
I just stumbled across a paper at MIT that makes it pretty clear that I’ve been reproducing a standard method already on the books. I’m still digesting the information, and there is lots of stuff in there about handling sensor frequency issues, but I figure most of that has been damped out by the oversampling in the DS18, and by the epoxy around the sensor nodes.
Addendum 2017-01-24

Shower combs from the local dollar-store worked well to keep the sensors separated.
We retired a few early generation temp. strings during the last round of fieldwork, and many of those had been deployed before I had a good calibration process. But we had months of data from them, so I now had the challenge of calibrating these sensors after the strings has been assembled. With 24 sensors per chain, they amounted to pretty hefty lump, and it would take some work to make sure they were all exposed to the circulating water bath properly. Some large combs provided the needed separation, and I mounted a 330Gph circulation pump near the center of the mass.
 So now I could use the waters cooling curve to do a decent normalization, but calibration with the was going to be tricky because of the thermal inertia of the epoxy around those sensors. I found a dead sensor from one of my early experiments, and drilled it out as a mount for the Reference Thermapen probe, providing it with approximately the same amount of lag as the sensors on the strings.
 The loggers recorded readings every 5min over 24 hours, for the group normalization (y=mx+b) coefficients . I did manual readings with the Thermapen every 30minutes which provided at least one reading per degree as the bath dropped from 35°C to 20°C. For that T-pen subset, I produced a second set of y=mx+b coefficients that corrected the group average used for normalization, into the reference temps. So the order of operations is reversed when compared to procedures that start with calibration of the raw DS18b20’s, but I’m happy to report that the process worked rather well, turning some jagged old data sets into smooth temperature profiles that compare very well to Hydrolab drop profiles from those same sites. In fact it worked so well, that I think I will do it with every chain that comes home, with a careful eye on the chains that had a decent calibration as individual sensors. I’ve seen plenty of pressure related problems in my other temp sensors, so I do wonder if the contraction of the epoxy is enough to hurt those initial calibrations?
Addendum 2017-04-28
While I like the $200 reference Thermapen I used for this calibration (and the NIST certificate that comes with it…) that ±0.04°C tool is probably out of reach for many DIY builders. I recently discovered the Silicon Labs Si7051 at Tindie for $9, which gives you 14-bit resolution of 0.01°C at ±0.1°C accuracy. I’ve been using these I2C sensors to calibrate 5% thermistors to better than ±0.2°C by baking all the system voltage errors into synthetic Steinhart-hart constants. That’s pretty good considering that the eBay thermistor and the reference thermometer together, cost less than a high quality thermistor. I still have other details to work out before I’m building temperature chains with thermistors, but I don’t think I’ll be able to resist that temptation for long…
Addendum 2017-09-04
Just noticed a nice DIY dry bath over at instructables.com. Though I’m not sure its accurate enough for calibration, you could still use it on the “natural cooling curve” side like I do with my wet/dry method. I’m sure there will be more good calibration kit coming out of the bio-hacking boys soon and they did some beautiful DS18b20 calibrations over at http://www.kandrsmith.org using the melt plateau of 99.99% gallium. And here’s an interesting “exposed” epoxy mounting of DS18b20’s in a liquid-cooled system.
Addendum 2020-04-07
Given how hard we have to work to bring DS18b20’s into line, I’m quite surprised to see someone using them as a reference standard. Also had no idea that K-type thermocouple sensors were so darned noisy – much worse than plain old thermistors. I’d be oversampling the heck out of those things, along with extremely vigorous circulation in that bath. Air calibrations? Fuhgeddaboutit.
